Photovoltaics- Outreach Kit
| Previous Topic | K-12 Outreach Kits | Next Topic |
Overview
Photovoltaics (PV) or solar cells are one of the most promising sources for renewable electrical energy. The first generation cells were made from silicon crystals like those used computer semiconductor chips. These are efficient but very expensive. Silicon PV were first widely used where the cost of wiring to the grid was impractical such as in satellites or to power remote sensors along pipelines or railway tracks. Materials research and improved manufacturing techniques have brought the price down to where they are beginning to become practical for home energy systems. Plastic solar cells that use organic chemicals instead of silicon may be the next breakthrough. These demos show some basic devices and engage students in quantifying their performance and considering how basic science relates to engineering design.
User Guide
Solar Car - Solar battery charger
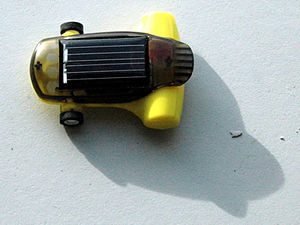
Solar energy can be converted to electrical energy using a solar cell. Demonstrate the solar car, the motor and rotor, and solar battery charger. Place the solar car in the full sun. What happens when the car passes into the shade? Demonstrate that the small silicon cell doesn’t generate enough energy to power the single LED but the larger amorphous silicon panel can power the light, even in indirect sunlight. Compare the solar electricity to power from a battery. See if they know about batteries polarity. Predict what would happen to the motor if you switch the leads to the solar cell. Reverse the polarity and the disc on the motor will rotate in the opposite direction.
- Research Connection: CMDITR is building a new kind of solar cell that uses an organic chemical to trap light and then transfer electrons to conductive layers.
Three types of solar cells.
There are several kinds of solar cells including single crystal, polycrystalline, amorphous silicon, cadmium telluride (CDTe) and now organic photovoltaics.
Brainstorm what characteristics would be desirable for a solar cell. Some possibilities power, costs, durability, flexibility, safety, ease of producing, environmental safe and plentiful materials. Demonstrate 2 types of solar cells in the kit.
- Research Connection: Cmditr Engineers and scientists are trying to develop the next generation of solar cells using organic chemicals. The advantage of these is that they can be produced cheaply, they can put printed on plastic, and materials are available.
Series vs Parallel circuits
- Explain the difference between voltage and current. Show that the large panel produces a higher voltage (because it has several cell areas wired in series).
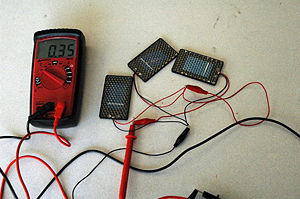
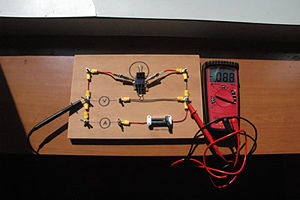
a. Explain the difference between voltage and current. Show that the large panel produces a higher voltage (because it has several cell areas wired in series). Measure the voltage and current produced from each cell using the digital meter. The wood test frame provides a convenient support and visual explanation of the circuit.
Note that the red lead must be moved and the selector switch set to mA to get the ammeter mode. Each cell has a characteristic voltage. Silicon cells produce between .5 -.6 V oc *(volts open circuit), OPVs are usually around .4 Voc. Use the clip leads and the three small panels to demonstrate that in a series circuit the voltage is added. In a parallel circuit the voltage does not change but the current (amperage) is increased.’
b. Compare the power for a 2 x 2 cm area for the crystalline solar cell compared to the same area of amorphous silicon cell.
P= V x I Power (watts) = Volts x Amps
Sample calculation: Volts = .4 V Amp = 50ma= .05 amp Power = .02 Watts
c. The amorphous panel provided is 7.2 V and 200 ma. How many of these panels would be needed to in what configuration to generate 100 Watts?
d. Experiment with different sources of light, sunlight, or diffuse vs. direct light
- Research Connection: CMDITR Engineers and scientists are trying to develop the next generation of solar cells using organic chemicals. The advantage of these is that they can be produced cheaply, they can put printed on plastic, and materials are available.
Power : area relationship
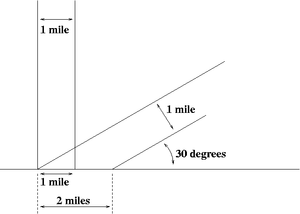
The larger the cross sectional area of the light beam that is trapped, the greater the power generated.
a. Cover portions of the panel to show decreasing current and voltage. Solar cells measured with the meter are under no load so you get the open circuit voltage (Voc). You should notice that the current responds quickly with decreasing light while the voltage stays somewhat stable, finally the voltage drops too. To measure the power from the panel you have to measure both voltage and amperage produced.
b. Plot the power versus area for the amorphous silicon panel. Complete the table and graph from BLM 1- Power vs Area Experiment
- Research Connection: OPVs could be less expensive even if they are less efficient which means a larger area could be deployed.
Power : distance relationship
Energy from a radiant light source drops off with distance.
a. Use the electric meter to measure the current produced by the sample silicon cell as you move away from a light source. As you move away from a diffuse light source the same amount of light is spread over a large area so the solar panel only intercepts part of the energy. This called the inverse square law. If you use a focused light source this relationship will not hold. At the distance we are from the sun it does not make any measurable difference how close (for example sea level versus on mountain top) we place solar cells to the sun.
b. Collect data and graph the experiment using BLM 2 – Power vs Distance Experiment
Power : Incidence Angle relationship
The angle with respect to the sun influences the energy output.
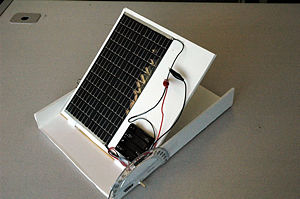
a. Set up the solar panel on its inclined support with protractor. Change the angle of the solar panel and measure the current. Changing the angle has the effect of decreasing the cross section of light that is intercepted. You can see this by measuring the shadow of the panel as it is tilted. In addition low angle sun on the Earth must pass through more atmosphere so some energy is absorbed.
b. Plot the current versus the angle. Complete the data and graph on BLM 3 Power vs Angle Experiment
c. Use this information to create a bar chart showing the total power generated by a cell during the course of day if the cell were fixed on a roof with an angle of 30 degrees. The peak angle of the sun on the spring or autumn equinox is 90- your latitude. At mid summer it is 90 – latitude -23.45 degrees. At mid winter it is 90 – latitude + 23.45 degrees
Research Connection: Engineers have designed tracking systems that keep PV panels facing perpendicular to sun all day long. Others have explored using concentrators to reflect light to a smaller area where the cell is.
- Engineers have designed tracking systems that keep PV panels facing perpendicular to sun all day long. Others have explored using concentrators to reflect light to a smaller area where the cell is.
Measuring Absorption Spectrum
Photovoltaics absorb light at specific wavelengths. a. Use the red, green and blue filters to show that certain colors when filtered out reduce the power more than other colors.
b. Plot the current versus wavelength when different colors are placed in front of the solar cell. You can use the large filter sheets or the filter sample booklets. Be sure to pick filters with approximately the same optical density. Use the attached transmission spectra tabs to pick colors that represent an even array across the spectrum. Complete BLM 4 Power vs Wavelength Experiment
c. Compare the amorphous silicon, the polycrystalline silicon cell, and the dye densitized solar cell.
- Research Connection: When we design chemicals to use in organic photovoltaics we measure the absorption spectra of the chromophores. Ideally we want dyes that absorb across the entire visible spectrum.
Measuring Efficiency
Efficiency is a measure of how much of the available energy is captured by a cell. It is the amount of electricity produced divided by the amount shining on the solar cell. To measure efficiency we have to know how much light energy is hitting the cell and how much electricity it is producing. It’s difficult to measure the incident light. Direct sunlight is between 250 and 1,000 W/m2.
a. In full sunlight measure the power of your solar cell and calculate the efficiency. In this example the cell has an area of 2.4 x 10⁻³ m2 , measuring .6 Volts and .5 amps in full sun
Pi = A * Ps = 2.4 x 10-3 * 1000 = 2.4 watts
Po = V x I = 0.6 x 0.5 = 0.3 W
e = Po/Pi = 0.3/2.4 = 0.12 = 12%
b. Repeat this measurement for various cells.
PV Cost estimation
Solar cells are still somewhat expensive. Several factors have to be considered in sizing a solar system. Calculate how much area is needed to power a house, how much would it cost?
- a. Solar cells currently run about $5-$9 per peak watt.
b. A house might require 2kW peak power c. If the silicon cells are 15% efficient and the d. Incoming energy is 1000 W/m2 assume 5 hours (5 kWh/m2) per day of useful sunlight or use the “Photovoltaics Solar Resource” map from NREL to identify the available solar resource for your area. e. If you aren’t connected to the grid you will need batteries which cost $1 amp hour
- Research Connection: Materials and manufacturing process determines the cost. Organic photovoltaics have a potential of being low cost because they can be manufactured with roll printing methods. Further research is needed to get higher efficiency, better durability (through encapusulation and decreased photobleaching) New organic solar cells may be much cheaper in the future.
PV characterization
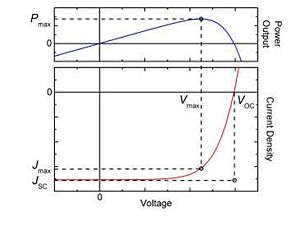
Solar cells are characterized using a voltage- current curve. a. Place the test PV cell in the wood test holder. Place an ammeter and a volt meter at the two pegs labeled A and V. Gradually change the series load in the circuit by sliding the variable resistor. Adjust the load to get an even series of voltage readings such as every .1 volts and record the amps for each voltage. Plot the data. The goal is to get a curve that is closer to a right angle (with a minimum fill factor). There is a certain combination of voltage and current that delivers peak power. b. Complete BLM 5 Current vs wavelength experiment
- Research Connection: CMDITR researcher do this same measurement with much finer accuracy.
Dye Sensitized Solar Cell
Organic pigments can be used to capture light to power electrochemical processes. Demonstrate the dye sensitized solar cell.Follow the separate directions to activate a titanium dioxide coated ITO slide to form a Graetzel cell. Beginning with a coated slide, add berry juice to sensitize the TiO2. Then apply iodide solution as an electrolyte and then pinch this together with the carbon black coated slide.
- Research Connection: Dye sensitized cells have begun commercial production as research continues.
Build the complete dye sensitized solar cell activity for high school
Links
Solar Cell Kit-How to build your own solar cell
Photovoltaic measurements Lesson
live insolation data for Las Vegas NREL Solar Data
Materials in the kit
- Sunzoom Lite car kit
- 4 AA battery PV battery charger
- 4 AA recharable NiCAD or LI ion batteries
- Solar mini car
- Digital Electric meter
- Protractor
- Ruler
Sources for Building your own kit
• http://shop.pitsco.com/store/detail.aspx?CategoryID=115&by=9&ID=2647&c=1&t=0&l=0 $8. 95 sunzoom lite car
• http://store.sundancesolar.com/subusobachki6.html 4 AA battery charger $39.95
• http://store.sundancesolar.com/misorokitsus.html mini solar car $9.95
• http://store.sundancesolar.com/ecdimu.html Electric Meter $12.95
• Light Source for indoor use- quartz desk lamp
• Color Filter pack for testing cells
• Rechargeable Batteries
