Basic Illustration Techniques
This section provides some basic tips on preparing graphics for publications or
Photos and image resources
Photos provide key content and visual variety to posters and publications. Usually you will be producing your own photos or transferring images directly from your research equipment. Occasionally you might need generic images to show the significance or application of your research. Wikimedia is the photo repository for Wikipedia and most photos have Creative Commons type licenses. Unlike other generic clipart or photo collections there is a lot of scientifically useful image there. Many are posted with sufficient rights so that you can use them in publication with attribution. Flickr Commons also has CC licensed images as well as some that have been listed a stock photos which can be purchased. Be careful about rights any time you use other's people photos.
To prepare illustrations of chemical structures consider the commercial program Chemdraw or the open source Organic Pad. If the structure is pretty common you might find it using Chem Spider.
Graphs
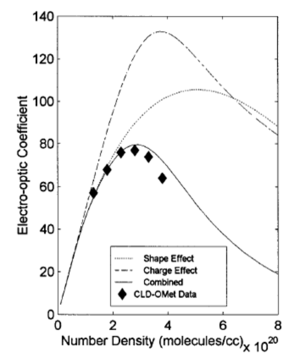
Create and format your graphs in Excel before copying and pasting into your illustration. Be sure to your graph is complete with axis labels, legends and title. Think ahead about the final publication medium. Colored lines are great in PowerPoint or a poster, but if you know it will be published in black and white be sure to use coded data symbols or line styles to make the data legible.
Photos and diagrams can be overlaid on graphs later in Photoshop where you compose the whole illustration.
Drawing with Powerpoint
Before starting a drawing pre-visualize what you trying to create. Consider Style- photographic, realistic, or schematic
View- Flat, cross section or perspective A cross section or edge view reveals internal structures. However multiple edge on views can be confusing and not everyone can understand immediate that a cross section is simply one view of a 3D shape. 3-d projections are more realistic and can convey multipe views at the same time.
Orthographic projection In an orthographic projection you see several sides of a shape at the same time. In an isometric drawing there are three distinct axes and with identical measures(There is no foreshortening)making it easy to transfer dimensions from a side views. In a perspective drawing there is foreshortening of the two axes reaching into the frame.
PowerPoint drawing tool box provides primitive shapes such as rectangles and parallelograms. Arranging these to make complex objects can be vexing and difficult to scale or twist. Its much easier to use the cube and cylinder tools which provide all faces, shading and are easily scaled. There are two ways to make 3D box.
Starting from a cube
The cube tool under the shapes group draws a simple cube with the front face parallel to the screen. (The rotation tool keeps the front face parallel to the screen which does not provide much control and rotation and 3-D effect tools can confusing if applied to cube.)
- Insert a cube
- Resizing using the corner controls control depth and width, and the yellow diamond to control height.
- Right click to format the shape and change the color, transparency and shadows.
- To get repeated patterns group elements and duplicate and paste.
Starting from a rectangle and adding 3D effects
Maximum control for a cube shape is achieved by making one from a simple rectangle which is then extruded.
- Create a rectangle
- Right click and format the shape
- Apply the fill and no- lines- (lines become solid walls when depth is added)
- Under 3D rotation click the preset rotation - isometric top surface
- Under 3-D format increase the depth and watch the rectangle become a 3D shape


