Difference between revisions of "Photovoltaics- Outreach Kit"
Cmditradmin (talk | contribs) |
Cmditradmin (talk | contribs) |
||
| Line 293: | Line 293: | ||
*[http://www.goldmine-elec-products.com/products.asp?dept=1174 Electronics Goldmine- A good source for various solar cells.] | *[http://www.goldmine-elec-products.com/products.asp?dept=1174 Electronics Goldmine- A good source for various solar cells.] | ||
*[http://scientificsonline.com/product | *[http://www.scientificsonline.com/product/low-cost-high-output-encapsulated-solar-cells-100ma Edmunds Scientific Individual cyrstalline silicon cells ] | ||
*[http://www.scientificsonline.com/product/cis-solar-panel Edmunds Scientific CIS Solar Panel @ $3.95] | *[http://www.scientificsonline.com/product/cis-solar-panel Edmunds Scientific CIS Solar Panel @ $3.95] | ||
Latest revision as of 12:21, 27 August 2015
| Previous Topic | K-12 Outreach Kits and Labs | Next Topic |
Overview
Photovoltaics (PV) or solar cells are one of the most promising sources for renewable electrical energy. The first generation cells were made from silicon crystals like those used in computer semiconductor chips. These are efficient but very expensive. Silicon PV were first widely used where the cost of wiring to the grid was impractical such as in satellites or to power remote sensors along pipelines or railway tracks. Materials research and improved manufacturing techniques have brought the price down to where they are beginning to become practical for home energy systems. Plastic solar cells that use organic chemicals instead of silicon may be the next breakthrough. These demos show some basic devices and engage students in quantifying their performance and considering how basic science relates to engineering design.
User Guide
Solar Car - Solar battery charger (motor - LED)
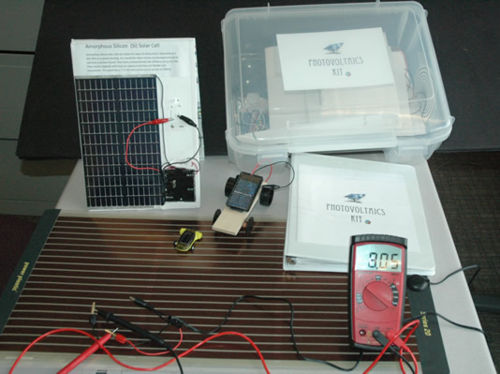
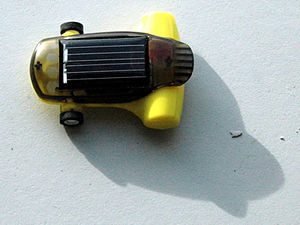
Solar energy can be converted to electrical energy using a solar cell. Demonstrate the solar car, the motor and rotor, and solar battery charger. Place the solar car in the full sun. What happens when the car passes into the shade? Demonstrate that the small silicon cell doesn’t generate enough energy to power the single LED but the larger amorphous silicon panel can power the light, even in indirect sunlight. Compare the solar electricity to power from a battery. See if they know about batteries polarity. Predict what would happen to the motor if you switch the leads to the solar cell. Reverse the polarity and the disc on the motor will rotate in the opposite direction.
- Research Connection: CMDITR is building a new kind of solar cell that uses an organic chemical to trap light and then transfer electrons to conductive layers.
Three types of solar cells.
There are several kinds of solar cells which differ power, cost, durability, and preferred applications.
Demonstrate the various types of solar cells in the kit by connecting them to a motor, voltmeter or LED.
a. Single crystal and Multicrystaline cell. The smaller cells in the kit are rated .45 volts and 400ma. Crystalline silicon solar cells (c-Si) can have efficiencies from 10-12% . They are produced from ingots of solid silicon and are rigid. These are the cells that most often used in space station where power density and durability are most important.
b. Amorphous silicon battery charger. The panel is rated 7.2 volt / 200ma and has diode built into the circuit to prevent battery discharge into the panel when it is dark. Amorphous silicon is made by depositing an extremely thin layer of silicon on a conductive polymer. As a result the panel is flexible. (a-Si) Amorphous silicon has a comparatively low 6% efficiency because the silicon is poorly organized creating barriers to charge movement but it makes up for this with a lower cost and ease of manufacturing.
c. Copper indium selenide (CIS) CIS and Copper indium gallium selenide cells (CIGS) have 14-20% efficiency. These cells must be full encapsulated to prevent release of toxic selenium. These cells have an open circuit voltage of 5 volts and a short circuit current of 95ma. Max power output is 3.9 volts at 64mA.
d. Organic photovoltaics (OPV)- currently maximum is 5-6.5 %. The Konarka Power Plastic is one of the few commercially available OPV panel. The advantage of organic or plastic solar cells is that they have the potential of extremely low material and manufacturing cost and they are flexible. A disadvantage is that organic materials have a limited lifetime especially in full sun and exposed to water and oxygen.
e. Dye Sensitized Solar Cell (DSS)Demonstrate the dye sensitize solar cell. Follow the separate directions to activate a titanium dioxide coated ITO slide to form a Graetzel cell. Beginning with a coated slide, add berry juice to sensitize the TiO2. Lightly coat the other slide with the carbon soot from a candle slide. Pinch the slides together with the binder clips so that the slides are offset exposing the conductive ITO layer. Apply iodide solution as an electrolyte and then.
f. Desktop Display – It’s convenient to mount the various demonstration cells on a display board so that the leads hang free and can be connected in a variety of ways. The output can be connected to a small motor with a rotating disc which is safe and impressive to kids. For indoor demonstrations a 100 watt equivalent fluorescent bulb (1700 lumens) in a clip-on holder works well because it stays cool and is safe around kids. Several of these can be used for more intensity or they can be placed very close to the cells.
g. Brainstorm what characteristics would be desirable for a solar cell. Some possibilities power, costs, durability, flexibility, safety, ease of producing, environmental safe and plentiful materials.
Research Connection: CMDITR Engineers and scientists are trying to develop the next generation of solar cells using organic chemicals. The research connects includes theoretical modeling of organic systems, synthesis, prototyping and testing.
- Research Connection: CCMDITR Engineers and scientists are trying to develop the next generation of solar cells using organic chemicals. The research connections includes theoretical modeling of organic systems, synthesis, prototyping and testing.
Series vs Parallel circuits
a. Explain the difference between voltage and current. Show that the large panel produces a higher voltage (because it has several cell areas wired in series). Measure the voltage and current produced from each cell using the digital meter. The digital multimeter has a dial setting for measuring voltage and amperage also note that the red lead must be moved and the selector switch set to mA to get the ammeter mode. Each cell has a characteristic voltage. Silicon cells produce between .5 -.6 V oc *(volts open circuit), OPVs are usually around .4 Voc.
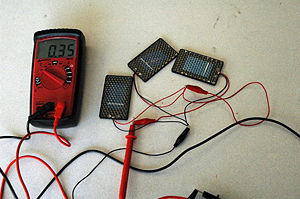
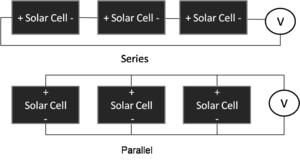
b. Explain the difference between series and parallel circuits. Use the clip leads and the three small panels to demonstrate that in a series circuit the voltage is added. In a parallel circuit the voltage does not change but the current (amperage) is increased.
Research Connection: The voltage of photovoltaic cells is determined by the band gap of energy for the combination of chemicals or materials used. Even low voltage devices can be combined in series or parallel circuits to get the correct power for desired applications.
Measuring Power Output
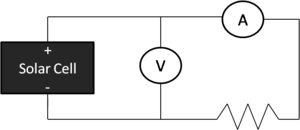
The power from a solar cell depends on the current and voltage. To measure the power, record the voltage and amperage of a solar cell across a load. The ammeter has built in precision resistors in its circuit. If you only had a voltmeter you could place a known resistor in the circuit and calculate current in amps as voltage divided by ohms. The peak power depends on specific load which affects the current and voltage (see voltage current graph below). For this activity you measure the voltage and current in a simple circuit without a load.
P= V x I Power (watts) = Volts x Amps
Sample calculation: Volts = .4 V Amp = 50ma= .05 amp Power = .02 Watts
a. Compare the power for a 3 x 4 cm area for the crystalline solar cell compared to the same area of amorphous silicon cell.
b. The amorphous panel provided is 7.2 V and 200 ma. How many of these panels would be needed to in what configuration to generate 100 Watts?
c. Experiment with different sources of light, sunlight, or diffuse vs. direct light
d. Experiment with the effect of temperature on cell power.
- Research Connection: CMDITR Engineers and scientists test their OPV cells in a similar manner by measuring voltage and current under different loads and light conditions to calculate the maximum efficiency. With a reliable way of comparing cells then it is possible to fine-tune the systems and methods to improve efficiency and longevity.
Power : area relationship
The larger the cross sectional area of the light beam that is trapped, the greater the power generated.
a. Cover portions of the panel to show decreasing current and voltage. Solar cells measured with the meter are under no load so you get the open circuit voltage (Voc). You should notice that the current responds quickly with decreasing light while the voltage stays somewhat stable, finally the voltage drops too. To measure the power from the panel you have to measure both voltage and amperage produced.
b. Plot the power versus area for the amorphous silicon panel. Complete the table and graph from BLM 1- Power vs Area Experiment
c. Repeat the measurement with a different pattern of shading (block the left, right top or bottom) You may get different results because of the wiring of cells within the array. Once a parallel section of panel is partially shaded it tends to knock out the whole section. Panels can also be equipped with bypass diodes which reroute current around underperforming cells.
- Research Connection: OPVs could be less expensive even if they are less efficient which means a larger area could be deployed.
Power : distance relationship
Energy from a radiant light source drops off with distance.
As you move away from a diffuse light source the same amount of light is spread over a large area so the solar panel only intercepts part of the energy. This called the inverse square law. It relates I intensity with r the distance.
- <math>I \propto \frac{1}{r^2} \,</math>
If you use a focused light source up close this relationship will not hold. At the distance we are from the sun it does not make any measurable difference how close (for example sea level versus on mountain top) we place solar cells to the sun. There is some variation in power available from the sun as we as the Earth’s orbit reaches perihelion. Currently this occurs in January when the Earth is 5million km (3 million miles) closer to the sun. This results in about 7% more solar energy striking the earth at perihelion.
a. Use the electric meter to measure the current produced by the sample silicon cell as you move away from a light source. Collect data and graph the experiment using BLM 2 – Power vs Distance Experiment
Power : Angle of Incidence relationship
The angle with respect to the sun influences the energy output. Changing the angle has the effect of decreasing the cross section of light that is intercepted. You can see this by measuring the shadow of the panel as it is tilted. In addition, low angle sun on the Earth must pass through more atmosphere so some energy is absorbed. This is described with the cosine law which relates I the insolation to S the incident solar energy (Watts/m2) and Z the Zenith angle of the surface with respect to the sun.
- <math>I = S cos Z\,\!</math>
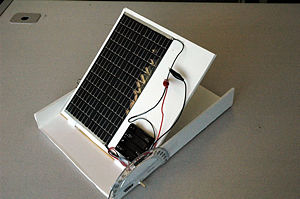
a. Set up the solar panel on its inclined support with protractor. Change the angle of the solar panel and measure the current. Plot the current versus the angle. Complete the data and graph on BLM 3 Power vs Angle Experiment.
b. Use this information to create a bar chart showing the total power generated by a cell during the course of day if the cell were fixed on a roof with an angle of 30 degrees. The peak angle of the sun on the spring or autumn equinox is 90 - your latitude. At mid-summer it is 90 – latitude - 23.45 degrees. At mid-winter it is 90 – latitude + 23.45 degrees
- Research Connection: Engineers have designed tracking systems that keep PV panels facing perpendicular to sun all day long. Others have explored using concentrators to reflect light to a smaller area where the cell is.
Measuring Absorption Spectrum
Photovoltaics absorb light at specific wavelengths.
The sunlight that reaches the Earth is spread over a larger spectrum. Some is visible and some stretches out into the infrared and is invisible. The irradiance at the Earth’s surface shows distinct dips at certain wavelengths due to absorption by atmospheric gases. Each kind of solar cell absorbs efficiently distinct wavelengths. Characterizing the absorption spectra is important.
a. Use the red, green and blue filters to show that certain colors when filtered out reduce the power more than other colors. Refer to the transmission spectra accompanying each filter to find its wavelength in nm.
b. Plot the current versus wavelength when different colors are placed in front of the solar cell. You can use the large filter sheets or the filter sample booklets. Be sure to pick filters with approximately the same optical density. Use the attached transmission spectra tabs to pick colors that represent an even array across the spectrum. Complete BLM 4 Power vs Wavelength Experiment.
c. Compare the amorphous silicon, the polycrystalline silicon cell, and the dye densitized solar cell.
- Research Connection: When we design chemicals to use in organic photovoltaics we measure the absorption spectra of the chromophores. Ideally we want dyes that absorb across the entire visible spectrum.
Measuring Efficiency
Efficiency is a measure of how much of the available energy is captured by a cell. It is the amount of electricity produced divided by the amount shining on the solar cell. To measure efficiency we have to know how much light energy is hitting the cell and how much electricity it is producing. It’s difficult to measure the incident light. Direct sunlight is between 250 and 1,000 W/m2.
a. In full sunlight measure the power of your solar cell and calculate the efficiency. In this example the cell has an area of 2.4 x 10⁻³ m2 , measuring .6 Volts and .5 amps in full sun
Pi = A * Ps = 2.4 x 10-3 * 1000 = 2.4 watts
Po = V x I = 0.6 x 0.5 = 0.3 W
e = Po/Pi = 0.3/2.4 = 0.12 = 12%
b. Repeat this measurement for various cells.
PV Cost estimation
Solar cells are still somewhat expensive. Several factors have to be considered in sizing a solar system. Calculate how much area is needed to power a house, how much would it cost?
a. Solar cells currently run about $5-$9 per peak watt.
b. A house might require 2kW peak power
c. If the silicon cells are 15% efficient and the incoming energy is 1000 W/m2 assume 5 hours (5 kWh/m2) per day of useful sunlight or use the “Photovoltaics Solar Resource” map from NREL to identify the available solar resource for your area.
d. If you aren’t connected to the grid you will need batteries which cost $1 amp hour
- Research Connection: Materials and manufacturing process determines the cost. Organic photovoltaics have a potential of being low cost because they can be manufactured with roll printing methods. Further research is needed to get higher efficiency, better durability (through encapusulation and decreased photobleaching) New organic solar cells may be much cheaper in the future.
PV characterization
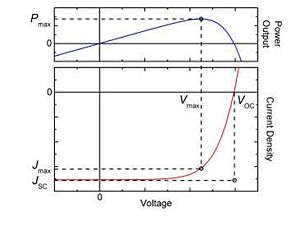
Solar cells are characterized using a voltage- current curve. Researchers build test cells using different materials and techniques and then test them in a controlled way. A common test is to create a voltage current plot. The curve goes between the open circuit voltage (Voc) and the short circuit current Isc. If you measure the voltage of solar cell with no load, that is the open circuit. The maximum voltage occurs when there is no resistance and no current. If you have an infinite resistance on the circuit there is no voltage but a maximum current. Somewhere between these extremes is the peak power, a combination of current times voltage which can be seen as the elbow on the voltage current curve. In this experiment a variable resistor is used to obtain a series of voltage and current pairs.
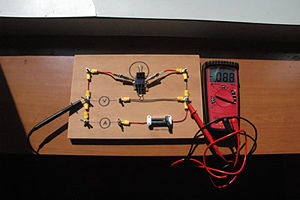
a. Place the test PV cell in the wood test holder. Place an ammeter and a volt meter at the two pegs labeled A and V. Gradually change the series load in the circuit by sliding the variable resistor. Adjust the load to get an even series of voltage readings such as every .1 volts and record the amps for each voltage. Plot the data. The goal is to get a curve that is closer to a right angle (with a minimum fill factor). There is a certain combination of voltage and current that delivers peak power.
b. Complete BLM 5 Current vs wavelength experiment
- Research Connection: CMDITR researcher do this same measurement with much finer accuracy.
PV characterization - with Probeware
Researchers usually use computers to collect and analyze PV performance data. The Pasco voltage/current probe connected to the USB link provides an easily visible display of solar cell performance. To set up the experiment follow these directions: 1) Set up a solar cell at a set distance from a light source or in full sun. Be sure to keep illumination constant through the measurements.
2) Connect the voltage probe to output of the solar cell using the black lead to the negative.
3) Connect the current probe to the output of the solar cell in series with a variable resistor. The resistor will be used to decrease the current from Jsc where there is maximum current but no voltage (since it is essentially a short circuit), to a maximum resistance Voc at which time there is no current flowing through the resistor but maximum voltage. Variable resistors will have to be carefully chosen; 0-100, 0-500, 0-1000 are possibilities.
4) Open the DataStudio activity called JVcurve.ds. It will display a graph with amps on the y axis and volts on the x, and a dial display for current and voltage meters. The sampling option is set to “Manual Sampling” and “Keep data values only when commanded. On both meters and graph the appropriate range is 0-.1 amps for current and 0-.5 volts.
5) Click “Start” to begin viewing the current and voltage. The “Start” button turns to “Keep” with a red stop square to the right. Each time you click “Keep” a data point is added to the graph at the instantaneous current and voltage levels. This data set is known as a “run” and is noted in the data summary area on the left with a matching icon on the graph. (An alternative method is to set the sampling method to timed and then repeatedly change the potentiometer to fill in the curve. Since this is continually collecting x-y points it can result in a large number of redundant pairs but is more impressive as a dynamic display).
6) Adjust the variable resistor from 0 ohms to full resistance in a series of steps. You’ll notice that as the resistance increases the voltage increases and the current decreases. Carefully adjust the variable resistor so that you get readings every .05 volts.
7) Click the red square to stop data collection. Click “start” to begin a new data set.
8) Repeat this measurement with different cell types, with different levels of illumination, and using different color filters.
Dye Sensitized Solar Cell
Organic pigments can be used to capture light to power electrochemical processes. Demonstrate the dye sensitized solar cell.Follow the separate directions to activate a titanium dioxide coated ITO slide to form a Graetzel cell. Beginning with a coated slide, add berry juice to sensitize the TiO2. Then apply iodide solution as an electrolyte and then pinch this together with the carbon black coated slide.
- Research Connection: Dye sensitized cells have begun commercial production as research continues.
Build the complete dye sensitized solar cell activity for high school
Posters
Courtesy of Ginger Research Group - UW- by Kristina Knesting, Brad MacLeod and Kevin Noone
<embed_document width="100%" height="800">http://depts.washington.edu/cmditr/media/Plastic_Solar_Cells.pdf</embed_document>
Download PowerPoint of Plastic Solar Cell Poster
<embed_document width="100%" height="800">http://depts.washington.edu/cmditr/media/OPVefficiency.pdf</embed_document>
Download PowerPoint of OPV Efficiency Poster
Links
Sources for Building your own kit
Solar Panels
Lab interface for doing current voltage studies
Solar cars
Miscellaneous
- Photovoltaic cell display boards printable file
- Cover art for Photovoltaics Kit printable file
- 100 watt halogen incandescent spot lights when you need high power for running cars, but be careful about melting the cells. or 250-500 W halogen worklights.
- Protractor
- Color Filter pack for testing cells
- Rechargeable Batteries
