Difference between revisions of "The OLED Test Cell"
Cmditradmin (talk | contribs) |
Cmditradmin (talk | contribs) |
||
| (37 intermediate revisions by 3 users not shown) | |||
| Line 1: | Line 1: | ||
[[Main_Page# | <table id="toc" style="width: 100%"> | ||
[[What is a Light Emitting Diode?|Next Topic]] | <tr> | ||
==Solution | <td style="text-align: left; width: 33%">[[Light Emitting Electrochemical Processes|Previous Topic]]</td> | ||
<td style="text-align: center; width: 33%">[[Main_Page#Organic_Light_Emitting_Diodes|Return to OLED Menu]]</td> | |||
<td style="text-align: right; width: 33%">[[What is a Light Emitting Diode?|Next Topic]]</td> | |||
</tr> | |||
</table> | |||
==Solution Electrogenerated Chemiluminescence Example Molecules== | |||
[[Image:OLED2 ECL.PNG|thumb|300px]] | [[Image:OLED2 ECL.PNG|thumb|300px]] | ||
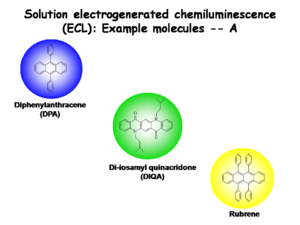
The following examples will focus on Diphenylanthracene since so much is known about its electrogenerated chemiluminescence ([[ECL]]). Diphenylanthracene (DPA), Di-iosamyl quinacridone, and Rubrene have the following characteristics: | |||
*Absorbance spectra in solution with vibronic fine structure | |||
*A small Stokes shifts | |||
*Luminescence spectra with corresponding vibronic fine structure | |||
<br clear="all"> | <br clear="all"> | ||
==Prototype Emissive Devices== | ==Prototype Emissive Devices== | ||
[[Image:OLED2 prototype.JPG|thumb| | [[Image:OLED2 prototype.JPG|thumb|400px|Solution electrogenerated chemiluminesence. | ||
]] | |||
Interest in ECL was so strong that in the 1970s several investigators decided it might be a usable way to create light. <ref>Keszthelyi CP, Laser D, Bard AJ. 1975. Journal of the Electrochemical Society 122: 1642-1642</ref> | |||
<ref>Laser D, Bard AJ. 1975. J. Electrochem. Soc. 122: 632-640</ref> | |||
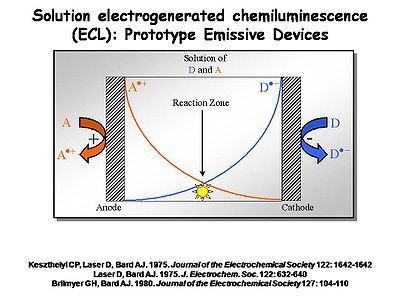
<ref>Brilmyer GH, Bard AJ. 1980. Journal of the Electrochemical Society 127: 104-110</ref> An electrochemical cell can be built with two electrodes separated by a narrow space filled with solution in which both acceptors (A) and donors (D) are located. A and D could be two different chemicals, or the same (as with [[diphenylanthracene]]). By independently controlling the potential of the two electrodes using a potentiostat, the cation radical form of A<sup>+.</sup> is generated at the anode at a diffusion-controlled rate. At the cathode you generate the radical anion form of D<sup>-.</sup> at a diffusion controlled rate. These molecules will diffuse away from the electrode at which they are produced into the solution between the electrodes. Where they meet at the center of the device the electron transfer reaction between the donor and the acceptor occurs, causing an emissive state to occur. | |||
*Layers must be very thin so they can be filled electrochemically in a very short period of time. | |||
*The possibility of interaction for the two molecules must be high. | |||
*The cation and anion radicals of the molecule must have long lifetimes, and must be carefully purified. | |||
*One of these electrodes must allow light to leave the system, otherwise there is no display. | |||
[[image:OLED2_energetics.JPG|thumb|400px|Characterization of the Energetics of Charge Recombination<ref>“Light Emitting Electrochemical Processes,” | |||
N.R. Armstrong, R.M. Wightman, E.M. Gross; | |||
Annu. Rev. Phys. Chem. 52, 391-422, (2001)</ref>]] | |||
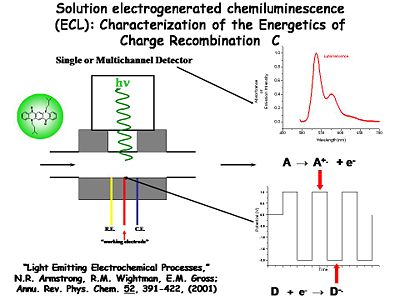
The solution ECL experiment is simple to construct. A flowing solution containing both D and A is passed in front of a Pt or Au microelectrode surrounded by a reference and counter electrode in a small solution cavity. The potential of the Au or Pt electrode is alternatively pulsed positive (to generate A<sup>+.</sup>) and negative (to generate D<sup>-.</sup>) with a typical frequency of several KHz. The products of these heterogeneous electron transfer reactions diffuse away from the electrode, where they are likely to encounter each other (on the time scale of microseconds). The resultant recombination reactions generate the emissive state of one pair of these molecules. The light from that emission event is coupled out to a multi-channel detector spectrophotometer which records the emission spectrum. | |||
One example is this non-display application used by Neal Armstrong (University of Arizona) and Mark Wightman (University of North Carolina) to study the dynamics of electron transfer and light emission. The setup has a very small solvent-containing cavity. A window in the center is positioned opposite a photomultiplier tube or some photodetector. There are three electrodes. A 5-50 micron diameter working electrode is positioned in the center, typically a small microband or microdisc electrode. The counter and reference electrodes are poised on either side. The solution cavity is able to flow in fresh solution periodically. | |||
See Keszthelyi 1975<ref>Keszthelyi CP, Laser D, Bard AJ. 1975. Journal of the Electrochemical Society 122: 1642-1642</ref> | |||
See Laser 1975 <ref>Laser D, Bard AJ. 1975. J. Electrochem. Soc. 122: 632-640</ref> | |||
See Brilmyer 19080<ref>Brilmyer GH, Bard AJ. 1980. Journal of the Electrochemical Society 127: 104-110</ref> | |||
See Armstrong 2001 <ref>“Light Emitting Electrochemical Processes,” N.R. Armstrong, R.M. Wightman, E.M. Gross; Annu. Rev. Phys. Chem. 52, 391-422, (2001)</ref> | |||
<br clear="all"> | <br clear="all"> | ||
==Characterization of the Energetics of Charge Recombination== | ==Characterization of the Energetics of Charge Recombination== | ||
The potential of the working electrode is modulated with respect to the reference electrode between two extremes. At one extreme it generates the cation radical (A<sup>+.</sup>) and at the other extreme it generates the anion radical (D<sup>-.</sup>). | |||
The potential of the these two extremes is cycled at frequencies of a kilohertz or more. By quickly flipping the potential back and forth, both species are generated in the diffusion layer volume next to the electrode surface, where they can interact and give off a photon which is counted with the detector. Wightman was able to monitor single photons and single electron transfer events with this system. Further studies of the light emitting process can be conducted using spectroscopy to compare with results from the device. | |||
==Cross Reactions== | ==Cross Reactions== | ||
[[Image: | [[Image:Dpa_voltammogram.png|thumb|400px|Voltammogram for reduction and oxidation of DPA]] | ||
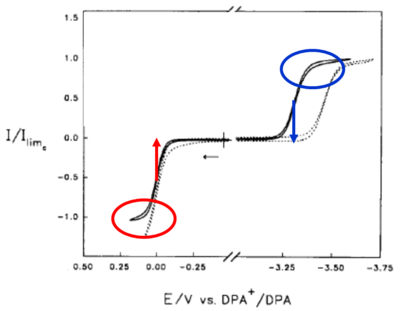
This an example of a | This an example of a [[Cyclic voltammetry |voltammogram]] obtained at the microelectrode for Diphenylanthracene (DPA) in a low dielectric constant solvent. The negative scan shows the microelectrode response for a one-electron reduction of DPA to its radical anion. The positive scan shows the one-electron oxidation of DPA to its radical cation form. The difference between the midpoint potentials is called the halfway potential. This shows the energy difference of the two forms, and hints at the amount of excess free energy that will be generated by the redox reaction that follows. In this reaction there is more than 3 electron volts of excess free energy. DPA's excited state easily forms and re-emits with a peak wavelength of about 450 nm. If you calculate the energy, this corresponds to 3-3.1 eV. So the electro-chemical event generated more than enough excess free energy to create the excited singlet state of DPA. | ||
Now | Now compare the yield of the DPA excited states while systematically changing the redox event that occurs. First generating the DPA anion with one pulse and the DPA cation with another pulse, the ΔE<sub>1/2</sub> is about 3.33 electron volts. This forms the excited singlet state known as the “S-route” . | ||
Next | Next, add a second species of Methoxybenzophonone, which reduces at a slightly less negative potential. It generates an anion radical at 3.24 electron volts. Spectroscopy shows that the DPA excited state is still formed, but slightly less efficiently. It is still an S-route process. | ||
With Benzophonone, it has a less negative potential with an excess free energy of 3.15 volts, and is still an S-route. | |||
<embed_document width="55%" height="400">http://depts.washington.edu/cmditr/media/OLED2_ecl_redoxpairs.pdf</embed_document> | <embed_document width="55%" height="400">http://depts.washington.edu/cmditr/media/OLED2_ecl_redoxpairs.pdf</embed_document> | ||
See Wightman 1995,1997 <ref>Wightman et.al.: JACS, 119 (1997) 11920. </ref><ref>JEAC, 396 (1995) 85.</ref> | |||
See [[wikipedia:Cyclic_voltammetry]] | |||
==Marcus Theory for Electron Transfer== | ==Marcus Theory for Electron Transfer== | ||
<embed_document width="55%" height="400">http://depts.washington.edu/cmditr/media/OLED2_marcustheory.pdf</embed_document> | <embed_document width="55%" height="400">http://depts.washington.edu/cmditr/media/OLED2_marcustheory.pdf</embed_document> | ||
The Marcus | The Marcus Theory for electron transfer provides some predictability to describe both probability of light emission from an ECL cross reaction, and the probability of light emission in an OLED at the interface between two dissimilar charge transporting layers. | ||
:<math>k_{et}\quad \propto \quad exp\bigg[\frac{-(\Delta G-\lambda)^2}{4 \lambda k_BT}\bigg]\,\!</math> | |||
In general as the excess Gibbs free energy (ΔE α ΔG) in the system is increased (Points a, b, c) so that ΔE (ΔG) is close to or exceeds | where | ||
:<math>\lambda\,\!</math> is the reorganization energy | |||
:<math>\Delta G\,\!</math> is the Gibbs free energy | |||
All electron transfer reactions proceed through a transition state whose energy is defined primarily by the “reorganization energy” (λ<sub>T</sub>). This energy can be divided into an “internal reorganization” energy (λ<sub>i</sub> -- the energy needed to reorganize the internal molecular environment in going from the initial to the final state), and the “external reorganization energy" (λ<sub>o</sub> – the energy needed to reorganize the solvent or condensed phase environment surrounding the molecule in proceeding from the initial to the final state). | |||
In general as the excess Gibbs free energy (ΔE α ΔG) in the system is increased (Points a, b, c in the slides above) so that ΔE (ΔG) is close to or exceeds λ<sub>T</sub> = λ<sub>i</sub> + λ<sub>o</sub> in magnitude, the reaction rate accelerates exponentially. For light-emitting electrochemical processes this reaction rate enhancement leads directly to greater production of emissive states. The output of the ECL process is controlled by the difference in reduction and oxidation potentials of the two reacting components. | |||
This provides some guidance in the design of two-layer OLEDs | This provides some guidance in the design of two-layer OLEDs when trying to maximize the excess free energy in the critical charge recombination process. | ||
First, we maximize free energy at point C. Then by changing the identity of the two pairs of the redox reaction we see less free energy at point B, and then finally point A. The excited state is generated at a lower overall rate. | |||
The rate is proportional to the | The rate at which the excited state occurs is proportional to the output of photons. This gives an underlying principal for the design of OLED systems. The goal is to maximize the free energy and minimize the reorganization energies for those redox events. By maximizing the rate of electron transfer, we maximize the rate of light output. | ||
This gives an underlying principal for the design of OLED systems. | |||
The | |||
Unfortunately the design is never that simple. | Unfortunately the design is never that simple. | ||
*The DPA+ + BP- | *The DPA<sup>+</sup> + BP<sup>-</sup> is shown in point A. | ||
*The DPA+ + MOPA- | *The DPA<sup>+</sup> + MOPA<sup>-</sup> is shown in point B | ||
*The DPA+ + DPA- system is | *The DPA<sup>+</sup> + DPA<sup>-</sup> system is shown in point C. | ||
By changing which species gets reduced, the excess free energy in the redox reaction is also changed. | |||
It is possible to create an excess free energy which exceeds the reorganization energy (point | It is possible to create an excess free energy which exceeds the reorganization energy (point D). In this case the reaction enters the “inverted region” and the reaction rate decreases. A few examples of this phenomenon have been observed in solutions and glasses, but it has not yet been reported in OLEDs. | ||
In the “Marcus inverted region”, the excess free energy is much larger than the reorganization energy. In this case the rate of reaction may decrease. To date this has not been discovered in OLEDs. It may have occurred but it is difficult to prove. | |||
See Marcus 1965 <ref>Marcus, R. A. J. Chem. Phys. 1965, 43, 2654-2657.</ref> | |||
See Marcus 1970 <ref>Marcus, R. A. J. Chem. Phys. 1970, 52, 2803-2804.</ref> | |||
See Sutin 1982 <ref>Sutin, N. Acc. Chem. Res. 1982, 15, 275-282.</ref> | |||
== References == | |||
<references/> | |||
[[category:organic LED]] | |||
<table id="toc" style="width: 100%"> | |||
<tr> | |||
<td style="text-align: left; width: 33%">[[Light Emitting Electrochemical Processes|Previous Topic]]</td> | |||
<td style="text-align: center; width: 33%">[[Main_Page#Organic_Light_Emitting_Diodes|Return to OLED Menu]]</td> | |||
<td style="text-align: right; width: 33%">[[What is a Light Emitting Diode?|Next Topic]]</td> | |||
</tr> | |||
</table> | |||
Latest revision as of 14:20, 8 November 2010
| Previous Topic | Return to OLED Menu | Next Topic |
Solution Electrogenerated Chemiluminescence Example Molecules
The following examples will focus on Diphenylanthracene since so much is known about its electrogenerated chemiluminescence (ECL). Diphenylanthracene (DPA), Di-iosamyl quinacridone, and Rubrene have the following characteristics:
- Absorbance spectra in solution with vibronic fine structure
- A small Stokes shifts
- Luminescence spectra with corresponding vibronic fine structure
Prototype Emissive Devices
Interest in ECL was so strong that in the 1970s several investigators decided it might be a usable way to create light. [1] [2] [3] An electrochemical cell can be built with two electrodes separated by a narrow space filled with solution in which both acceptors (A) and donors (D) are located. A and D could be two different chemicals, or the same (as with diphenylanthracene). By independently controlling the potential of the two electrodes using a potentiostat, the cation radical form of A+. is generated at the anode at a diffusion-controlled rate. At the cathode you generate the radical anion form of D-. at a diffusion controlled rate. These molecules will diffuse away from the electrode at which they are produced into the solution between the electrodes. Where they meet at the center of the device the electron transfer reaction between the donor and the acceptor occurs, causing an emissive state to occur.
- Layers must be very thin so they can be filled electrochemically in a very short period of time.
- The possibility of interaction for the two molecules must be high.
- The cation and anion radicals of the molecule must have long lifetimes, and must be carefully purified.
- One of these electrodes must allow light to leave the system, otherwise there is no display.

The solution ECL experiment is simple to construct. A flowing solution containing both D and A is passed in front of a Pt or Au microelectrode surrounded by a reference and counter electrode in a small solution cavity. The potential of the Au or Pt electrode is alternatively pulsed positive (to generate A+.) and negative (to generate D-.) with a typical frequency of several KHz. The products of these heterogeneous electron transfer reactions diffuse away from the electrode, where they are likely to encounter each other (on the time scale of microseconds). The resultant recombination reactions generate the emissive state of one pair of these molecules. The light from that emission event is coupled out to a multi-channel detector spectrophotometer which records the emission spectrum.
One example is this non-display application used by Neal Armstrong (University of Arizona) and Mark Wightman (University of North Carolina) to study the dynamics of electron transfer and light emission. The setup has a very small solvent-containing cavity. A window in the center is positioned opposite a photomultiplier tube or some photodetector. There are three electrodes. A 5-50 micron diameter working electrode is positioned in the center, typically a small microband or microdisc electrode. The counter and reference electrodes are poised on either side. The solution cavity is able to flow in fresh solution periodically.
See Keszthelyi 1975[5]
See Laser 1975 [6]
See Brilmyer 19080[7]
See Armstrong 2001 [8]
Characterization of the Energetics of Charge Recombination
The potential of the working electrode is modulated with respect to the reference electrode between two extremes. At one extreme it generates the cation radical (A+.) and at the other extreme it generates the anion radical (D-.). The potential of the these two extremes is cycled at frequencies of a kilohertz or more. By quickly flipping the potential back and forth, both species are generated in the diffusion layer volume next to the electrode surface, where they can interact and give off a photon which is counted with the detector. Wightman was able to monitor single photons and single electron transfer events with this system. Further studies of the light emitting process can be conducted using spectroscopy to compare with results from the device.
Cross Reactions
This an example of a voltammogram obtained at the microelectrode for Diphenylanthracene (DPA) in a low dielectric constant solvent. The negative scan shows the microelectrode response for a one-electron reduction of DPA to its radical anion. The positive scan shows the one-electron oxidation of DPA to its radical cation form. The difference between the midpoint potentials is called the halfway potential. This shows the energy difference of the two forms, and hints at the amount of excess free energy that will be generated by the redox reaction that follows. In this reaction there is more than 3 electron volts of excess free energy. DPA's excited state easily forms and re-emits with a peak wavelength of about 450 nm. If you calculate the energy, this corresponds to 3-3.1 eV. So the electro-chemical event generated more than enough excess free energy to create the excited singlet state of DPA.
Now compare the yield of the DPA excited states while systematically changing the redox event that occurs. First generating the DPA anion with one pulse and the DPA cation with another pulse, the ΔE1/2 is about 3.33 electron volts. This forms the excited singlet state known as the “S-route” .
Next, add a second species of Methoxybenzophonone, which reduces at a slightly less negative potential. It generates an anion radical at 3.24 electron volts. Spectroscopy shows that the DPA excited state is still formed, but slightly less efficiently. It is still an S-route process.
With Benzophonone, it has a less negative potential with an excess free energy of 3.15 volts, and is still an S-route.
<embed_document width="55%" height="400">http://depts.washington.edu/cmditr/media/OLED2_ecl_redoxpairs.pdf</embed_document>
See Wightman 1995,1997 [9][10]
See wikipedia:Cyclic_voltammetry
Marcus Theory for Electron Transfer
<embed_document width="55%" height="400">http://depts.washington.edu/cmditr/media/OLED2_marcustheory.pdf</embed_document>
The Marcus Theory for electron transfer provides some predictability to describe both probability of light emission from an ECL cross reaction, and the probability of light emission in an OLED at the interface between two dissimilar charge transporting layers.
- <math>k_{et}\quad \propto \quad exp\bigg[\frac{-(\Delta G-\lambda)^2}{4 \lambda k_BT}\bigg]\,\!</math>
where
- <math>\lambda\,\!</math> is the reorganization energy
- <math>\Delta G\,\!</math> is the Gibbs free energy
All electron transfer reactions proceed through a transition state whose energy is defined primarily by the “reorganization energy” (λT). This energy can be divided into an “internal reorganization” energy (λi -- the energy needed to reorganize the internal molecular environment in going from the initial to the final state), and the “external reorganization energy" (λo – the energy needed to reorganize the solvent or condensed phase environment surrounding the molecule in proceeding from the initial to the final state).
In general as the excess Gibbs free energy (ΔE α ΔG) in the system is increased (Points a, b, c in the slides above) so that ΔE (ΔG) is close to or exceeds λT = λi + λo in magnitude, the reaction rate accelerates exponentially. For light-emitting electrochemical processes this reaction rate enhancement leads directly to greater production of emissive states. The output of the ECL process is controlled by the difference in reduction and oxidation potentials of the two reacting components.
This provides some guidance in the design of two-layer OLEDs when trying to maximize the excess free energy in the critical charge recombination process.
First, we maximize free energy at point C. Then by changing the identity of the two pairs of the redox reaction we see less free energy at point B, and then finally point A. The excited state is generated at a lower overall rate.
The rate at which the excited state occurs is proportional to the output of photons. This gives an underlying principal for the design of OLED systems. The goal is to maximize the free energy and minimize the reorganization energies for those redox events. By maximizing the rate of electron transfer, we maximize the rate of light output.
Unfortunately the design is never that simple.
- The DPA+ + BP- is shown in point A.
- The DPA+ + MOPA- is shown in point B
- The DPA+ + DPA- system is shown in point C.
By changing which species gets reduced, the excess free energy in the redox reaction is also changed. It is possible to create an excess free energy which exceeds the reorganization energy (point D). In this case the reaction enters the “inverted region” and the reaction rate decreases. A few examples of this phenomenon have been observed in solutions and glasses, but it has not yet been reported in OLEDs.
In the “Marcus inverted region”, the excess free energy is much larger than the reorganization energy. In this case the rate of reaction may decrease. To date this has not been discovered in OLEDs. It may have occurred but it is difficult to prove.
See Marcus 1965 [11]
See Marcus 1970 [12]
See Sutin 1982 [13]
References
- ↑ Keszthelyi CP, Laser D, Bard AJ. 1975. Journal of the Electrochemical Society 122: 1642-1642
- ↑ Laser D, Bard AJ. 1975. J. Electrochem. Soc. 122: 632-640
- ↑ Brilmyer GH, Bard AJ. 1980. Journal of the Electrochemical Society 127: 104-110
- ↑ “Light Emitting Electrochemical Processes,” N.R. Armstrong, R.M. Wightman, E.M. Gross; Annu. Rev. Phys. Chem. 52, 391-422, (2001)
- ↑ Wightman et.al.: JACS, 119 (1997) 11920.
- ↑ JEAC, 396 (1995) 85.
- ↑ Marcus, R. A. J. Chem. Phys. 1965, 43, 2654-2657.
- ↑ Marcus, R. A. J. Chem. Phys. 1970, 52, 2803-2804.
- ↑ Sutin, N. Acc. Chem. Res. 1982, 15, 275-282.
| Previous Topic | Return to OLED Menu | Next Topic |


