Difference between revisions of "Absorption and Emission"
Cmditradmin (talk | contribs) |
Cmditradmin (talk | contribs) |
||
| (20 intermediate revisions by 2 users not shown) | |||
| Line 7: | Line 7: | ||
</table> | </table> | ||
Absorption and emission are often used as characteristics that help identify substances. In photonics they are the core properties of molecules which make them useful. Materials can be designed that absorb light at one wavelength and emit it at another. Specific colors need to be matched to the application that the materials are intended for. Theory helps explain why molecules behave as they do and provide guidance for manipulating their design. | |||
=== Vibronic Progression === | |||
[[Image:Abs_Emis_stokes.png|thumb|200px|Emission and absorption spectra showing vibronic structure]] | |||
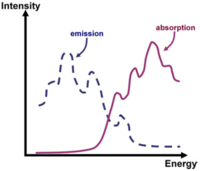
Vibronic progression can be seen in the absorption and emission spectra. Vibronic progression means that there is a coupling to vibrational modes in a polymer or oligomer resulting in excitation from the ground state to the excited state, or emission from the excited state down to the ground state. | |||
<br clear='all'> | |||
=== Change in excited state geometry === | === Change in excited state geometry === | ||
[[Image:Transpolyacetylene_vib.png|thumb|300px|Changes in transpolyacetylene during excitation]] | [[Image:Transpolyacetylene_vib.png|thumb|300px|Changes in transpolyacetylene during excitation]] | ||
Consider the first optically allowed excited state of the transpolyacetylene which has a 1 Bu symmetry. As the molecule moves from the ground state to that first optically excited state, there is a shift of the double bonds from one bond to the next resulting in a shift of the pi bond densities from one bond to the next. This is described as the reversal of the bond length alternation pattern. If there is a single excitation on a long polyacetylene chain, that modification will be localized somewhere. | Consider the first optically allowed excited state of the transpolyacetylene which has a 1 Bu symmetry. As the molecule moves from the ground state to that first optically excited state, there is a shift of the double bonds from one bond to the next resulting in a shift of the π bond densities from one bond to the next. This is described as the reversal of the bond length alternation pattern. If there is a single excitation on a long polyacetylene chain, that modification will be localized somewhere. | ||
For PPV | For PPV begins as a chain where the rings are aromatic-like, with single, double, single bonds between the rings. The wave functions of the HOMO and the LUMO, and the π bonding and anti- bonding pattern dictates that going to the excited state an electron leaves the HOMO and goes into the LUMO resulting in a change in the π-bond densities creating a quinoline-like structure. In between the rings, there is a double bond, single bond, double bond, or a larger factor of that kind. | ||
<br clear='all'> | <br clear='all'> | ||
| Line 23: | Line 26: | ||
[[Image:Transpolyacetylene_vibstretch.png|thumb|300px|Changes in bond lengths during excitation for polyacetylene]] | [[Image:Transpolyacetylene_vibstretch.png|thumb|300px|Changes in bond lengths during excitation for polyacetylene]] | ||
Because of the π bond densities shifting | Because of the π bond densities shifting there will be geometry relaxation when moving from the ground state to the excited state. There will be a coupling with vibrational modes, that leads from the ground state geometry to the excited state geometry. In the case of polyacetylene, these modes brings the top carbon closer to the right, the bottom carbon to the left, then the next top one to the right, bottom one to the left. The same pattern happens for PPV. In other words, there will be strong coupling to vibrational modes that correspond to C-C stretching. Remember the C-C stretching modes in those polymers are at the order of about 1400 - 1600 wave numbers and 0.15 - 0.2 eV. | ||
<br clear='all'> | <br clear='all'> | ||
=== Geometry relaxation in S<sub>1</sub> of PPV5 === | === Geometry relaxation in S<sub>1</sub> of PPV5 === | ||
[[Image:C-cbondchange_exitation.png|thumb|400px|Change in bond length vs site position during excitation]] | [[Image:C-cbondchange_exitation.png|thumb|400px|Change in bond length vs site position during excitation]] | ||
Consider a linear representation of long PPV chain with about 5 rings in order to relate all the bond lengths directly with their modification, from the ground state to the excited state. This plot shows how the C-C bond length changes from the ground state to the S<sub>1</sub> excited state in that five ring oligomer. From the plot, it can be inferred that the double bond increases significantly in length by .03 Å (angstrom), where as the single bond actually shortens by about .03 | Consider a linear representation of long PPV chain with about 5 rings in order to relate all the bond lengths directly with their modification, from the ground state to the excited state. This plot shows how the C-C bond length changes from the ground state to the S<sub>1</sub> excited state in that five ring oligomer. From the plot, it can be inferred that the double bond increases significantly in length by .03 Å (angstrom), where as the single bond actually shortens by about .03 Å or more. In other words, the diagram shows the difference in bond length as you go from the optimal geometry in the ground state to the optimal geometry of the S<sub>1</sub> state. It is clear that the vinylene double bonds increase in length and the single bonds between rings decrease in length. There is a reversal of the bond length alternation within the vinylene units. Also, within the quinoid rings, you do get an evolution of the bonds that leads you to a more quinoid structure. The geometry relaxation to form the S<sub>1</sub> excited state in this oligomer takes place over something like 20 carbons. Polaron relaxation takes place was over about 20 carbons as does the exciton in long chains of PPV. | ||
<br clear='all'> | <br clear='all'> | ||
| Line 34: | Line 37: | ||
[[Image:Potentialenergy_surfacechang.png|thumb|400px|The potential energy surface of the ground state and of the excited state.The potential energy surface of the ground state varies over about 2 eV.]] | [[Image:Potentialenergy_surfacechang.png|thumb|400px|The potential energy surface of the ground state and of the excited state.The potential energy surface of the ground state varies over about 2 eV.]] | ||
The abscissa of this graph is the deformation coordinates, which is how the system deforms; the modifications in the coordinates of | The abscissa of this graph is the deformation coordinates, which is how the system deforms; the modifications in the coordinates of the system. The lower figure is the optimal geometry of the ground state, and it is different from the optimal geometry of the S<sub>1</sub> state that is shown above. The two potential energy surfaces are displaced with respect to one another. The larger the relaxation in the excited state, the larger the geometry of the modification in the excited state, and thus, the larger the displacement would be. If the geometry in the excited state were to be exactly the same as in the ground state, then the two potential energy curves would sit on top of one another. The vibrational levels corresponding to those C-C stretching modes are connected to the geometry relaxation in the excited state and therefore, they are connected to the electronic transition. The dashed curves show the zero vibrational level, the first vibrational level, the 2nd vibrational level and so on. At room temperature, the vibrational mode has energy of on the order of 0.15 to 0.2 electron volts. The energy difference between the zeroth vibrational level and the first vibrational excitation is higher than the kinetic energy available at room temperature(room temperature kT is 0.025eV). In other words, in the ground state, basically all of the oligomers or polymers are in the zeroth vibrational level. | ||
The curve of the dotted lines is the vibrational wave function. In the vibrational ground state, there is no node. In the first excitation state there is one node, and in the 2nd vibrational excited state there are 2 nodes, and so on. The same thing is what you would have if you were to simply look at a particle in the box. In the vibrational ground state, the largest probabilities to find the molecule or the polymer is in the middle. That is the state when the photons strike. The transition takes place faster than the geometry relaxation and thus, there is a vertical transition. Since the potential energy curves are displaced, if you start from the most probable situation in the ground state, and go up, you can have the largest overlap of the vibrational wave functions with the first or the second vibrational level. When there is a coupling of the electronic transition with vibrational modes, the intensity of your electronic transition is modulated by the overlap of the vibrational wave functions as you go up the excited state potential energy surface. | The curve of the dotted lines is the vibrational wave function. In the vibrational ground state, there is no node. In the first excitation state there is one node, and in the 2nd vibrational excited state there are 2 nodes, and so on. The same thing is what you would have if you were to simply look at a particle in the box. In the vibrational ground state, the largest probabilities to find the molecule or the polymer is in the middle. That is the state when the photons strike. The transition takes place faster than the geometry relaxation and thus, there is a vertical transition. Since the potential energy curves are displaced, if you start from the most probable situation in the ground state, and go up, you can have the largest overlap of the vibrational wave functions with the first or the second vibrational level. When there is a coupling of the electronic transition with vibrational modes, the intensity of your electronic transition is modulated by the overlap of the vibrational wave functions as you go up the excited state potential energy surface. | ||
| Line 40: | Line 43: | ||
The rule of thumb is that the more the potential energy curve in the excited state is displaced, the larger the relaxation of the geometry in the excited state, and the larger the displacement, the higher the vibrational level, where there will be strong overlap between the ground state vibrational wave function of the electronic ground state and the excited vibrational wave function of the excited electronic state. However, if there were no displacement in the excited state or the two curves were perfectly superimposed on top of one another, then there will be a very strong overlap between the zero vibrational level of the bottom curve and the zero vibrational level of the excited state. But the overlap between the zero vibrational level of the bottom curve and any of the other ones above would be zero. | The rule of thumb is that the more the potential energy curve in the excited state is displaced, the larger the relaxation of the geometry in the excited state, and the larger the displacement, the higher the vibrational level, where there will be strong overlap between the ground state vibrational wave function of the electronic ground state and the excited vibrational wave function of the excited electronic state. However, if there were no displacement in the excited state or the two curves were perfectly superimposed on top of one another, then there will be a very strong overlap between the zero vibrational level of the bottom curve and the zero vibrational level of the excited state. But the overlap between the zero vibrational level of the bottom curve and any of the other ones above would be zero. | ||
If the absorption into the first excited state of a pi conjugated system is extremely sharp, there is hardly any geometry relaxation in the excited state because one potential energy curve is right on top of the other. The broadness of the absorption curve indicates a large of the change in geometry in the excited state. For instance, cyanines are important in nonlinear optics. Cyanines and thalocyanines have extremely sharp optical transitions and absorptions. This is because the geometry of the ground state and the excited state are basically identical. However, with systems like oligo PPVs or other conjugated polymers or oligomers, there are geometry relaxations that are significant in the S<sub>1</sub> state and the two potential energy surfaces are displaced. The larger the displacement, the higher the most intense transition will be going up the vibrational level scale of the top curve. | If the absorption into the first excited state of a π conjugated system is extremely sharp, there is hardly any geometry relaxation in the excited state because one potential energy curve is right on top of the other. The broadness of the absorption curve indicates a large of the change in geometry in the excited state. For instance, cyanines are important in nonlinear optics. Cyanines and thalocyanines have extremely sharp optical transitions and absorptions. This is because the geometry of the ground state and the excited state are basically identical. However, with systems like oligo PPVs or other conjugated polymers or oligomers, there are geometry relaxations that are significant in the S<sub>1</sub> state and the two potential energy surfaces are displaced. The larger the displacement, the higher the most intense transition will be going up the vibrational level scale of the top curve. | ||
Vibronic progressions that go from 0 level below to 0 level above will be referred to as 0-0 absorption. Then you have the 0-1 absorption, 0-2 absorption, 0-3 and so on. For example, 0-2 absorption is the most intense and the geometry relaxations in the excited state will be pretty strong. For 0-1, there is a geometry relaxation but not as large as 0-2. A 0-0 absorption means there is not much geometry relaxation. | Vibronic progressions that go from 0 level below to 0 level above will be referred to as 0-0 absorption. Then you have the 0-1 absorption, 0-2 absorption, 0-3 and so on. For example, 0-2 absorption is the most intense and the geometry relaxations in the excited state will be pretty strong. For 0-1, there is a geometry relaxation but not as large as 0-2. A 0-0 absorption means there is not much geometry relaxation. | ||
| Line 48: | Line 51: | ||
=== Stokes Shifts === | === Stokes Shifts === | ||
[[Image:Abs_Emis_stokes.png|thumb|300px| | [[Image:Abs_Emis_stokes.png|thumb|300px|With a Stokes shift emission an absorption are offset from each other]] | ||
Absorption starts at 0-0 and then 0-1, 0-2, 0-3, 0-4, and so on. The 0-2 absorption is the most intense. If the energy of the vibrational mode is 0.2 | Absorption starts at 0-0 and then 0-1, 0-2, 0-3, 0-4, and so on. The 0-2 absorption is the most intense. If the energy of the vibrational mode is 0.2 eV, or if 0-2 is the most intense, there is a relaxation of about 0.4 eV in the excited state because the transition from the zeroth vibrational level of the ground state to the 2nd vibrational level of the electronic excited state is most dominant. From that 2nd vibrational level, the system will trickle down to the zeroth vibrational level for a total of change of 0.4 eV. | ||
When the 0-0 transitions in absorption and emission are on top of one another, there is no Stokes shift. When the 0-0 transitions are separated from one another, there is a Stokes shift. | When the 0-0 transitions in absorption and emission are on top of one another, there is no Stokes shift. When the 0-0 transitions are separated from one another, there is a Stokes shift. For example, in the case for transpolyacetylene where the absorption is into the 1bu state, (which is actually the S<sub>2</sub> state). From there the system trickles down to the S<sub>1</sub> state. Then the very feeble emission that is obtained from the S<sub>1</sub> state will be displaced, with respect to what you have in absorption. But rigorously speaking, the Stoke shift occurs only if the 0-0 transitions have different energies?. Often there is an abuse in the literature because in the literature, usually when you look at the absorption band, you can’t see all that fine structure and it makes it harder to decide where the 0-0 band is. For instance, if you consider the entire emission and absorption envelope the difference between the peaks in absorption and emission are sometimes referred to as a Stokes shift. In the case of PPV, there is no reason for any Stokes shift because the 0-0 transitions are the same energies. | ||
For example, in the case for transpolyacetylene where the absorption is into the 1bu state, (which is actually the | |||
A structured emission diagram gives a clue to the vibronic progression. The difference between the energies of those two peaks can usually give you the energy of the vibrational mode that is coupled to the electronic transition. | A structured emission diagram gives a clue to the vibronic progression. The difference between the energies of those two peaks can usually give you the energy of the vibrational mode that is coupled to the electronic transition. When there are several modes that are coupled, things become quickly a bit more complicated. However, in those π conjugated systems, you can do very well with such an analysis. | ||
=== Absorption and | === Absorption and emission in oligophenylene vinylenes === | ||
[[Image:Stilbene_abs_emis.png|thumb|300px|Experimental absorption and emission spectra of oligophenylene vinylenes. 77K in inert PMMA matrix.]] | [[Image:Stilbene_abs_emis.png|thumb|300px|Experimental absorption and emission spectra of oligophenylene vinylenes. 77K in inert PMMA matrix.]] | ||
These are oligophenylene vinylenes going from two rings (n is the number of rings) to five rings. When n = 2, it is stilbene. The graph shows the redshift of the absorption as the systems becomes increasingly conjugated. Also, for the shorter species, the 0-2 transition is almost as intense as the 0-1 transition. As the chain elongates, the 0-1 becomes slightly more intense than the 0-2 but there is not much difference there. On the other hand, in the case of the emission, there is a pretty strong evolution. The stilbene 0-1 is by far the most intense where as for the five ring oligomer, the 0-0 is more intense more intense than the 0-1. This reflects something pretty simple. Think in terms of ionization: Taking away an electron from the stilbene that has 14 pi electrons results in a big perturbation. Conversely, taking away an electron from a longer chain with 100 pi electrons will give a smaller perturbation. The same applies for the excitation. An excitation of a very small molecule will give a pretty large | These are oligophenylene vinylenes going from two rings (n is the number of rings) to five rings. When n = 2, it is stilbene. The graph shows the redshift of the absorption as the systems becomes increasingly conjugated. Also, for the shorter species, the 0-2 transition is almost as intense as the 0-1 transition. As the chain elongates, the 0-1 becomes slightly more intense than the 0-2 but there is not much difference there. On the other hand, in the case of the emission, there is a pretty strong evolution. The stilbene 0-1 is by far the most intense where as for the five ring oligomer, the 0-0 is more intense more intense than the 0-1. This reflects something pretty simple. Think in terms of ionization: Taking away an electron from the stilbene that has 14 π electrons results in a big perturbation. Conversely, taking away an electron from a longer chain with 100 π electrons will give a smaller perturbation. The same applies for the excitation. An excitation of a very small molecule will give a pretty large perturbation. As the chain elongates the perturbation becomes less important. As the chain gets longer and longer, the excitation eventually localizes over four or five rings and ends up having the same type of relaxation beyond the five or six ring system as would occur for a very long chain. | ||
The electronic coupling between the ground state and the | The electronic coupling between the ground state and the S<sub>1</sub> state is the same whether you go from S<sub>0</sub> to S<sub>1</sub> or S<sub>1</sub> to S<sub>0</sub>. Thus, the electronic coupling also referred to as the transition dipole or the oxidative strength is the same. A photon of the right energy will be absorbed with a very high probability. In emission, that will depend on the luminescence quantum yield. If you have a system that has a very small quantum yield then you will see very small photons come out in emission. But in terms of the intrinsic electronic coupling, transition dipole, between the electronic ground state and the electronic excited state, it is exactly the same; whether you go from S<sub>0</sub> to S<sub>1</sub> or S<sub>1</sub> to S<sub>0</sub>. | ||
Very often the emission curve will be sharper than absorption. The reason is that, unless | Very often the emission curve will be sharper than absorption. The reason is that, unless it is a perfectly ordered system, usually there is some disorder so that the five ring chains can be slightly distorted in one way in one molecule and in a slightly different way in another molecule. Although the oligomers have exactly the same length, there will be a slight distribution of the optical transition depending on whether the chains are perfectly coplanar and therefore more conjugated, or the chains are more strongly twisted. This type of disorder leads to an absorption that is broader. The reason why is when you look at the first absorption band like at 8 eV, the perfectly coplanar chains can absorb at about 275 and other slightly distorted chains can absorb at 276, others at 277 and so on. | ||
As soon as the energy of the photon is large enough, any molecule in the thin film will be able to absorb. Remember that the excited state has a given life time on the order of nanoseconds. During that life time, the excited state on a slightly distorted molecule can jump on a less distorted molecule and therefore, have a smaller excited state energy. Since the system is more conjugated, the band gap is smaller and the excited state energy is smaller. Therefore, what will happen is that the excitation will move across the material and will get to the most perfectly conjugated molecules because these are the ones for which the energy of the excited state is smallest. Because they emit only from the most well conjugated molecules, the emission will be from a single species where as in absorption, you can have not only the most conjugated but also the slightly distorted molecules that will also absorb. Absorption will indicate disorder in the system much more than emission will. | As soon as the energy of the photon is large enough, any molecule in the thin film will be able to absorb. Remember that the excited state has a given life time on the order of nanoseconds. During that life time, the excited state on a slightly distorted molecule can jump on a less distorted molecule and therefore, have a smaller excited state energy. Since the system is more conjugated, the band gap is smaller and the excited state energy is smaller. Therefore, what will happen is that the excitation will move across the material and will get to the most perfectly conjugated molecules because these are the ones for which the energy of the excited state is smallest. Because they emit only from the most well conjugated molecules, the emission will be from a single species where as in absorption, you can have not only the most conjugated but also the slightly distorted molecules that will also absorb. Absorption will indicate disorder in the system much more than emission will. | ||
'''Simulation of Emission''' | |||
[[Image:Emission_simulation_exp.png|thumb|300px|Simulation of absorption. S1 relaxation energy decreases as the chain grows.]] | [[Image:Emission_simulation_exp.png|thumb|300px|Simulation of absorption. S1 relaxation energy decreases as the chain grows.]] | ||
The theoretical data matches the experimental data. | The theoretical data matches the experimental data. | ||
<br clear='all'> | <br clear='all'> | ||
[[Image:Emission_simulation.png|thumb|400px|Simulation of emission predicts various transition energies.]] | [[Image:Emission_simulation.png|thumb|400px|Simulation of emission predicts various transition energies.]] | ||
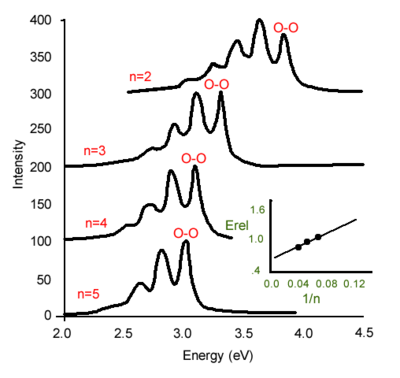
In stilbene the relaxation energy is .27 eV. As | In stilbene the relaxation energy is .27 eV. As the length increases the relaxation comes down to .15eV. The relaxation energy as a function of 1/n shows a linear relationship. A relaxation energy of .15 eV for the S<sub>1</sub> excited state is typical for many polymers. The 0-1 is almost as large as the 0-1 transition in simulating the emission spectrum. | ||
<br clear='all'> | |||
[[category:absorption]] | |||
[[category:luminescence]] | |||
<table id="toc" style="width: 100%"> | <table id="toc" style="width: 100%"> | ||
<tr> | <tr> | ||
| Line 83: | Line 86: | ||
</tr> | </tr> | ||
</table> | </table> | ||
Latest revision as of 09:33, 7 July 2010
| Previous Topic | Return to Absorption and Emission Menu | Next Topic |
Absorption and emission are often used as characteristics that help identify substances. In photonics they are the core properties of molecules which make them useful. Materials can be designed that absorb light at one wavelength and emit it at another. Specific colors need to be matched to the application that the materials are intended for. Theory helps explain why molecules behave as they do and provide guidance for manipulating their design.
Vibronic Progression
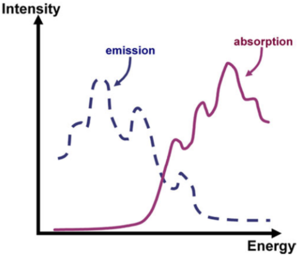
Vibronic progression can be seen in the absorption and emission spectra. Vibronic progression means that there is a coupling to vibrational modes in a polymer or oligomer resulting in excitation from the ground state to the excited state, or emission from the excited state down to the ground state.
Change in excited state geometry
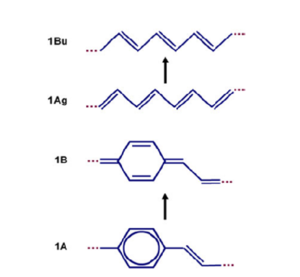
Consider the first optically allowed excited state of the transpolyacetylene which has a 1 Bu symmetry. As the molecule moves from the ground state to that first optically excited state, there is a shift of the double bonds from one bond to the next resulting in a shift of the π bond densities from one bond to the next. This is described as the reversal of the bond length alternation pattern. If there is a single excitation on a long polyacetylene chain, that modification will be localized somewhere.
For PPV begins as a chain where the rings are aromatic-like, with single, double, single bonds between the rings. The wave functions of the HOMO and the LUMO, and the π bonding and anti- bonding pattern dictates that going to the excited state an electron leaves the HOMO and goes into the LUMO resulting in a change in the π-bond densities creating a quinoline-like structure. In between the rings, there is a double bond, single bond, double bond, or a larger factor of that kind.
Vibrational modes
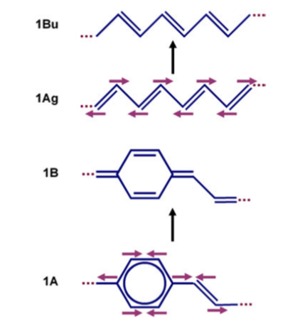
Because of the π bond densities shifting there will be geometry relaxation when moving from the ground state to the excited state. There will be a coupling with vibrational modes, that leads from the ground state geometry to the excited state geometry. In the case of polyacetylene, these modes brings the top carbon closer to the right, the bottom carbon to the left, then the next top one to the right, bottom one to the left. The same pattern happens for PPV. In other words, there will be strong coupling to vibrational modes that correspond to C-C stretching. Remember the C-C stretching modes in those polymers are at the order of about 1400 - 1600 wave numbers and 0.15 - 0.2 eV.
Geometry relaxation in S1 of PPV5
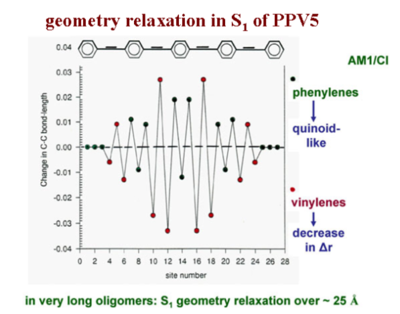
Consider a linear representation of long PPV chain with about 5 rings in order to relate all the bond lengths directly with their modification, from the ground state to the excited state. This plot shows how the C-C bond length changes from the ground state to the S1 excited state in that five ring oligomer. From the plot, it can be inferred that the double bond increases significantly in length by .03 Å (angstrom), where as the single bond actually shortens by about .03 Å or more. In other words, the diagram shows the difference in bond length as you go from the optimal geometry in the ground state to the optimal geometry of the S1 state. It is clear that the vinylene double bonds increase in length and the single bonds between rings decrease in length. There is a reversal of the bond length alternation within the vinylene units. Also, within the quinoid rings, you do get an evolution of the bonds that leads you to a more quinoid structure. The geometry relaxation to form the S1 excited state in this oligomer takes place over something like 20 carbons. Polaron relaxation takes place was over about 20 carbons as does the exciton in long chains of PPV.
Transitions and vibrational levels
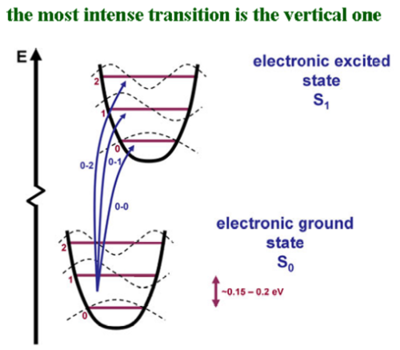
The abscissa of this graph is the deformation coordinates, which is how the system deforms; the modifications in the coordinates of the system. The lower figure is the optimal geometry of the ground state, and it is different from the optimal geometry of the S1 state that is shown above. The two potential energy surfaces are displaced with respect to one another. The larger the relaxation in the excited state, the larger the geometry of the modification in the excited state, and thus, the larger the displacement would be. If the geometry in the excited state were to be exactly the same as in the ground state, then the two potential energy curves would sit on top of one another. The vibrational levels corresponding to those C-C stretching modes are connected to the geometry relaxation in the excited state and therefore, they are connected to the electronic transition. The dashed curves show the zero vibrational level, the first vibrational level, the 2nd vibrational level and so on. At room temperature, the vibrational mode has energy of on the order of 0.15 to 0.2 electron volts. The energy difference between the zeroth vibrational level and the first vibrational excitation is higher than the kinetic energy available at room temperature(room temperature kT is 0.025eV). In other words, in the ground state, basically all of the oligomers or polymers are in the zeroth vibrational level.
The curve of the dotted lines is the vibrational wave function. In the vibrational ground state, there is no node. In the first excitation state there is one node, and in the 2nd vibrational excited state there are 2 nodes, and so on. The same thing is what you would have if you were to simply look at a particle in the box. In the vibrational ground state, the largest probabilities to find the molecule or the polymer is in the middle. That is the state when the photons strike. The transition takes place faster than the geometry relaxation and thus, there is a vertical transition. Since the potential energy curves are displaced, if you start from the most probable situation in the ground state, and go up, you can have the largest overlap of the vibrational wave functions with the first or the second vibrational level. When there is a coupling of the electronic transition with vibrational modes, the intensity of your electronic transition is modulated by the overlap of the vibrational wave functions as you go up the excited state potential energy surface.
The rule of thumb is that the more the potential energy curve in the excited state is displaced, the larger the relaxation of the geometry in the excited state, and the larger the displacement, the higher the vibrational level, where there will be strong overlap between the ground state vibrational wave function of the electronic ground state and the excited vibrational wave function of the excited electronic state. However, if there were no displacement in the excited state or the two curves were perfectly superimposed on top of one another, then there will be a very strong overlap between the zero vibrational level of the bottom curve and the zero vibrational level of the excited state. But the overlap between the zero vibrational level of the bottom curve and any of the other ones above would be zero.
If the absorption into the first excited state of a π conjugated system is extremely sharp, there is hardly any geometry relaxation in the excited state because one potential energy curve is right on top of the other. The broadness of the absorption curve indicates a large of the change in geometry in the excited state. For instance, cyanines are important in nonlinear optics. Cyanines and thalocyanines have extremely sharp optical transitions and absorptions. This is because the geometry of the ground state and the excited state are basically identical. However, with systems like oligo PPVs or other conjugated polymers or oligomers, there are geometry relaxations that are significant in the S1 state and the two potential energy surfaces are displaced. The larger the displacement, the higher the most intense transition will be going up the vibrational level scale of the top curve.
Vibronic progressions that go from 0 level below to 0 level above will be referred to as 0-0 absorption. Then you have the 0-1 absorption, 0-2 absorption, 0-3 and so on. For example, 0-2 absorption is the most intense and the geometry relaxations in the excited state will be pretty strong. For 0-1, there is a geometry relaxation but not as large as 0-2. A 0-0 absorption means there is not much geometry relaxation.
In emission first there is absorption and then the excited state comes down to the lowest vibrational level of the lowest excited state during its life time. So the emission will take place from from the 0 level. Then, depending on the overlap of the vibrational wave functions, it will come down to levels ground state levels 2,1 or 0. But in emission, the largest energy transition (or emission) will be the 0-0. Where as in absorption, since you start with the zeroth vibrational level of the ground state, the 0-0 will have the smallest energy of the transmission.
Stokes Shifts
Absorption starts at 0-0 and then 0-1, 0-2, 0-3, 0-4, and so on. The 0-2 absorption is the most intense. If the energy of the vibrational mode is 0.2 eV, or if 0-2 is the most intense, there is a relaxation of about 0.4 eV in the excited state because the transition from the zeroth vibrational level of the ground state to the 2nd vibrational level of the electronic excited state is most dominant. From that 2nd vibrational level, the system will trickle down to the zeroth vibrational level for a total of change of 0.4 eV.
When the 0-0 transitions in absorption and emission are on top of one another, there is no Stokes shift. When the 0-0 transitions are separated from one another, there is a Stokes shift. For example, in the case for transpolyacetylene where the absorption is into the 1bu state, (which is actually the S2 state). From there the system trickles down to the S1 state. Then the very feeble emission that is obtained from the S1 state will be displaced, with respect to what you have in absorption. But rigorously speaking, the Stoke shift occurs only if the 0-0 transitions have different energies?. Often there is an abuse in the literature because in the literature, usually when you look at the absorption band, you can’t see all that fine structure and it makes it harder to decide where the 0-0 band is. For instance, if you consider the entire emission and absorption envelope the difference between the peaks in absorption and emission are sometimes referred to as a Stokes shift. In the case of PPV, there is no reason for any Stokes shift because the 0-0 transitions are the same energies.
A structured emission diagram gives a clue to the vibronic progression. The difference between the energies of those two peaks can usually give you the energy of the vibrational mode that is coupled to the electronic transition. When there are several modes that are coupled, things become quickly a bit more complicated. However, in those π conjugated systems, you can do very well with such an analysis.
Absorption and emission in oligophenylene vinylenes
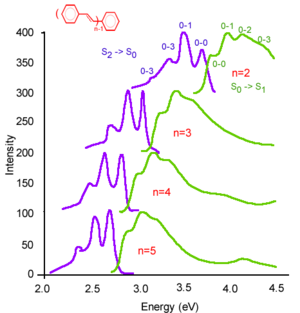
These are oligophenylene vinylenes going from two rings (n is the number of rings) to five rings. When n = 2, it is stilbene. The graph shows the redshift of the absorption as the systems becomes increasingly conjugated. Also, for the shorter species, the 0-2 transition is almost as intense as the 0-1 transition. As the chain elongates, the 0-1 becomes slightly more intense than the 0-2 but there is not much difference there. On the other hand, in the case of the emission, there is a pretty strong evolution. The stilbene 0-1 is by far the most intense where as for the five ring oligomer, the 0-0 is more intense more intense than the 0-1. This reflects something pretty simple. Think in terms of ionization: Taking away an electron from the stilbene that has 14 π electrons results in a big perturbation. Conversely, taking away an electron from a longer chain with 100 π electrons will give a smaller perturbation. The same applies for the excitation. An excitation of a very small molecule will give a pretty large perturbation. As the chain elongates the perturbation becomes less important. As the chain gets longer and longer, the excitation eventually localizes over four or five rings and ends up having the same type of relaxation beyond the five or six ring system as would occur for a very long chain.
The electronic coupling between the ground state and the S1 state is the same whether you go from S0 to S1 or S1 to S0. Thus, the electronic coupling also referred to as the transition dipole or the oxidative strength is the same. A photon of the right energy will be absorbed with a very high probability. In emission, that will depend on the luminescence quantum yield. If you have a system that has a very small quantum yield then you will see very small photons come out in emission. But in terms of the intrinsic electronic coupling, transition dipole, between the electronic ground state and the electronic excited state, it is exactly the same; whether you go from S0 to S1 or S1 to S0.
Very often the emission curve will be sharper than absorption. The reason is that, unless it is a perfectly ordered system, usually there is some disorder so that the five ring chains can be slightly distorted in one way in one molecule and in a slightly different way in another molecule. Although the oligomers have exactly the same length, there will be a slight distribution of the optical transition depending on whether the chains are perfectly coplanar and therefore more conjugated, or the chains are more strongly twisted. This type of disorder leads to an absorption that is broader. The reason why is when you look at the first absorption band like at 8 eV, the perfectly coplanar chains can absorb at about 275 and other slightly distorted chains can absorb at 276, others at 277 and so on.
As soon as the energy of the photon is large enough, any molecule in the thin film will be able to absorb. Remember that the excited state has a given life time on the order of nanoseconds. During that life time, the excited state on a slightly distorted molecule can jump on a less distorted molecule and therefore, have a smaller excited state energy. Since the system is more conjugated, the band gap is smaller and the excited state energy is smaller. Therefore, what will happen is that the excitation will move across the material and will get to the most perfectly conjugated molecules because these are the ones for which the energy of the excited state is smallest. Because they emit only from the most well conjugated molecules, the emission will be from a single species where as in absorption, you can have not only the most conjugated but also the slightly distorted molecules that will also absorb. Absorption will indicate disorder in the system much more than emission will.
Simulation of Emission
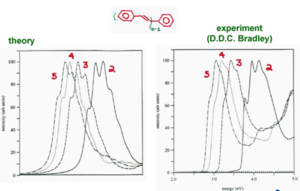
The theoretical data matches the experimental data.
In stilbene the relaxation energy is .27 eV. As the length increases the relaxation comes down to .15eV. The relaxation energy as a function of 1/n shows a linear relationship. A relaxation energy of .15 eV for the S1 excited state is typical for many polymers. The 0-1 is almost as large as the 0-1 transition in simulating the emission spectrum.
| Previous Topic | Return to Absorption and Emission Menu | Next Topic |
