Difference between revisions of "Basic Illustration Techniques"
Cmditradmin (talk | contribs) m (→Graphs) |
Cmditradmin (talk | contribs) m (→Graphs) |
||
| Line 17: | Line 17: | ||
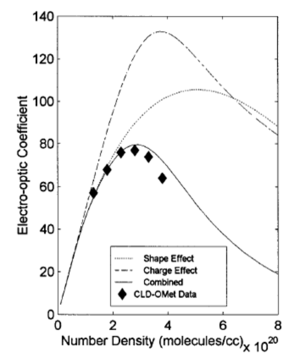
Create and format your graphs in Excel before copying and pasting into your illustration. Be sure to your graph is complete with axis labels, legends and title. Think ahead about the final publication medium. Colored lines are great in PowerPoint or a poster, but if you know it will be published in black and white be sure to use coded data symbols or line styles to make the data legible. | Create and format your graphs in Excel before copying and pasting into your illustration. Be sure to your graph is complete with axis labels, legends and title. Think ahead about the final publication medium. Colored lines are great in PowerPoint or a poster, but if you know it will be published in black and white be sure to use coded data symbols or line styles to make the data legible. | ||
[[Image:Eo_stability.png|thumb|300px|Graph and image combined- Jen Group ]] | |||
Photos and diagrams can be overlaid on graphs later in Photoshop where you compose the whole illustration. | Photos and diagrams can be overlaid on graphs later in Photoshop where you compose the whole illustration. | ||
<br clear='all'> | |||
=== Drawing with Powerpoint === | === Drawing with Powerpoint === | ||
Revision as of 13:21, 3 February 2011
This section provides some basic tips on preparing graphics for publications or
Photos and image resources
Photos provide key content and visual variety to posters and publications. Usually you will be producing your own photos or transferring images directly from your research equipment. Occasionally you might need generic images to show the significance or application of your research. Wikimedia is the photo repository for Wikipedia and most photos have Creative Commons type licenses. Unlike other generic clipart or photo collections there is a lot of scientifically useful image there. Many are posted with sufficient rights so that you can use them in publication with attribution. Flickr Commons also has CC licensed images as well as some that have been listed a stock photos which can be purchased. Be careful about rights any time you use other's people photos.
To prepare illustrations of chemical structures consider the commercial program Chemdraw or the open source Organic Pad. If the structure is pretty common you might find it using Chem Spider.
Graphs
Create and format your graphs in Excel before copying and pasting into your illustration. Be sure to your graph is complete with axis labels, legends and title. Think ahead about the final publication medium. Colored lines are great in PowerPoint or a poster, but if you know it will be published in black and white be sure to use coded data symbols or line styles to make the data legible.
Photos and diagrams can be overlaid on graphs later in Photoshop where you compose the whole illustration.

