Difference between revisions of "Organic Photovoltaic Fabrication and Test Apparatus"
Cmditradmin (talk | contribs) m |
|||
| (9 intermediate revisions by 2 users not shown) | |||
| Line 7: | Line 7: | ||
=== Overview === | === Overview === | ||
It takes many trials to perfect the materials and techniques that make for highly efficient organic solar cells. This apparatus at University of Arizona combines a vacuum fabrication area with a inert gas glove box where prototype cells can be tested under controlled circumstance. | It takes many trials to perfect the materials and techniques that make for highly efficient organic solar cells. This apparatus at University of Arizona combines a vacuum fabrication area with a inert gas glove box where prototype cells can be tested under controlled circumstance. Organic photovoltaic devices are typically built with either the technique of vacuum deposition or spin coating. Either system allows the progressive build up of very thin uniform layers of chemicals and metallics. In spin coating the test surface is coated with a chemical and then spun at high speeds in a centrifuge so that excess material thins out. Vacuum deposition allows building up of layers one atom at a time and permits very precise control over the surface characteristics. | ||
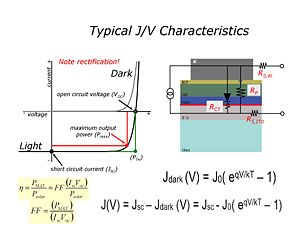
The most common test is to generate a voltage vs current curve by experimentally varying the level of light used to excite the cell and by continually changing the load on the cell using a variable voltage power supply (reverse polarity). First a the cell is kept in the dark and a whole series of voltages are applied while the current is measured. Then this series of measurements is repeated while the cell is illuminated. Typical measurements open-circuit voltage (V<sub>oc</sub>), short-circuit current (I<sub>sc</sub>), fill factor (FF), maximum power output of the device (P<sub>max</sub>), voltage at maximum power (V<sub>max</sub>), current at maximum power (I<sub>max</sub>). A higher Fill Factor means that the cells is operating closer to its theoretical maximum efficiency. | The most common test is to generate a voltage vs current curve by experimentally varying the level of light used to excite the cell and by continually changing the load on the cell using a variable voltage power supply (reverse polarity). First a the cell is kept in the dark and a whole series of voltages are applied while the current is measured. Then this series of measurements is repeated while the cell is illuminated. Typical measurements open-circuit voltage (V<sub>oc</sub>), short-circuit current (I<sub>sc</sub>), fill factor (FF), maximum power output of the device (P<sub>max</sub>), voltage at maximum power (V<sub>max</sub>), current at maximum power (I<sub>max</sub>). A higher Fill Factor means that the cells is operating closer to its theoretical maximum efficiency. | ||
[[Image:opvtestingoverview.jpg|thumb|300px|]] | |||
Prototype cells are then tested with and "artificial sun" lamp that is calibrated for power. The voltage across the cell is controlled and the current is measured at known light intensities. This allows you to create a curve that lets you pick the highest power output parameters. | |||
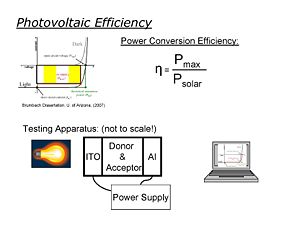
The basic configuration for OPV testing appartus measures the output power Pmax and this is compared to the input solar power Psolar. This gives you n the Power conversion efficiency. OPV these days are operating at between 3% and 6%. | |||
<br clear='all'> | |||
[[Image:Opvtesting.jpg|thumb|300px|]] | |||
:<math>n = \frac{P_{MAX}}{P_{solar}}=FF \frac{(I_{sc} V_{oc})}{P_{solar}}\,\!</math> | |||
where | |||
:<math>P_{MAX}\,\!</math> is the maximum measures output | |||
:<math>P_{solar}\,\!</math> is the applied solar radiation | |||
:<math>I_{sc}\,\!</math> is the short circuit current | |||
:<math>V_{oc}\,\!</math> is the open circuit voltage | |||
See wiki article on [[Physics_of_Solar_Cells]] | See wiki article on [[Physics_of_Solar_Cells]] | ||
=== Operation === | === Device Tour and Operation === | ||
<swf width=" | {{#ev:youtube|3kozKRTuZmg}} | ||
<swf width="800" height="600">http://depts.washington.edu/cmditr/media/opvfab.swf</swf> | |||
=== Significance === | === Significance === | ||
One example of research using performance chararcterization is being being carried out by the Armstrong group at U of A. | |||
In this example variations of preparation of the ITO surface can be precisely compared. | |||
Poster: Characterizing and Modifying the ITO/Organic Interface: Organic Solar Cells | |||
[[Image:ITO-OPV.png|thumb|600px|center|The performance of organic photovoltaics can be drastically affected by the treatment the ITO receives. These treatments can change the ITO’s work function, remove carbon and/or hydroxides and change the relative ratio of In/Sn on the surface. This variability affects device repeatability and the performance of large-area devices | |||
]] | |||
[[category:Research equipment]] | |||
Latest revision as of 14:37, 25 May 2010
| Return to Research Tool Menu |
Overview
It takes many trials to perfect the materials and techniques that make for highly efficient organic solar cells. This apparatus at University of Arizona combines a vacuum fabrication area with a inert gas glove box where prototype cells can be tested under controlled circumstance. Organic photovoltaic devices are typically built with either the technique of vacuum deposition or spin coating. Either system allows the progressive build up of very thin uniform layers of chemicals and metallics. In spin coating the test surface is coated with a chemical and then spun at high speeds in a centrifuge so that excess material thins out. Vacuum deposition allows building up of layers one atom at a time and permits very precise control over the surface characteristics.
The most common test is to generate a voltage vs current curve by experimentally varying the level of light used to excite the cell and by continually changing the load on the cell using a variable voltage power supply (reverse polarity). First a the cell is kept in the dark and a whole series of voltages are applied while the current is measured. Then this series of measurements is repeated while the cell is illuminated. Typical measurements open-circuit voltage (Voc), short-circuit current (Isc), fill factor (FF), maximum power output of the device (Pmax), voltage at maximum power (Vmax), current at maximum power (Imax). A higher Fill Factor means that the cells is operating closer to its theoretical maximum efficiency.
Prototype cells are then tested with and "artificial sun" lamp that is calibrated for power. The voltage across the cell is controlled and the current is measured at known light intensities. This allows you to create a curve that lets you pick the highest power output parameters.
The basic configuration for OPV testing appartus measures the output power Pmax and this is compared to the input solar power Psolar. This gives you n the Power conversion efficiency. OPV these days are operating at between 3% and 6%.
- <math>n = \frac{P_{MAX}}{P_{solar}}=FF \frac{(I_{sc} V_{oc})}{P_{solar}}\,\!</math>
where
- <math>P_{MAX}\,\!</math> is the maximum measures output
- <math>P_{solar}\,\!</math> is the applied solar radiation
- <math>I_{sc}\,\!</math> is the short circuit current
- <math>V_{oc}\,\!</math> is the open circuit voltage
See wiki article on Physics_of_Solar_Cells
Device Tour and Operation
<swf width="800" height="600">http://depts.washington.edu/cmditr/media/opvfab.swf</swf>
Significance
One example of research using performance chararcterization is being being carried out by the Armstrong group at U of A. In this example variations of preparation of the ITO surface can be precisely compared. Poster: Characterizing and Modifying the ITO/Organic Interface: Organic Solar Cells

